Statistical Forecasting
Prerequisites
The N2 Core modules, N2 Action module and the built-in Contacts module must be installed.
If you have not installed the N2 modules yet, please refer to the Quick Start guide.
Complete the Simple Workflow tutorial.
Please refer to the Simple Workflow tutorial to understand the basics for creating N2 workflow.
Recommended Additional Modules
Because forecasting relies on historical data, it is recommended to install the Demo Data Generator and Demo Sales Data Generator modules as well — unless you already have sufficient historical data or are using another dummy data generator.
Creating Statistical Forecasts
In this section, you will create a workflow that creates a forecast using the nodes from N2 Forecast module.
- Go to N2 -> Configuration -> Forecast Store.
- Create new Forecast Store, name it
My Forecast Storeand save it. - Create a new graph.
- Add
StartNode,ForecastContextNode,BrowseDataNode,ForecastDataNode,TrainNode,ForecastModelStoreNode,ForecastNode,ForecastNode,ForecastResultNode,HistoricAverageNode,AutoEtsNode,FillGapsNode,TimeAggregateNodeand connect them. Refer to the figure below on how these nodes are connected. - Set the
Model Storefield on theForecastContextNodetoMy Forecast Store. - Set the
Modelfield on theBrowseDataNodetoSales Order. - Set the
Order byfield on theForecastDataNodetoOrder Date. - Add these field mapping to the
ForecastDataNode: - Field
Order Date(date_order) is mapped todswithDateTimeSeriesrole. - Field
Total(amount_total) is mapped toamountwithTargetrole. - Set the
Horizonfield on theForecastNodeto7. - Set the
Season Lengthfield on theAutoEtsNodeto7. - Save and process the graph.
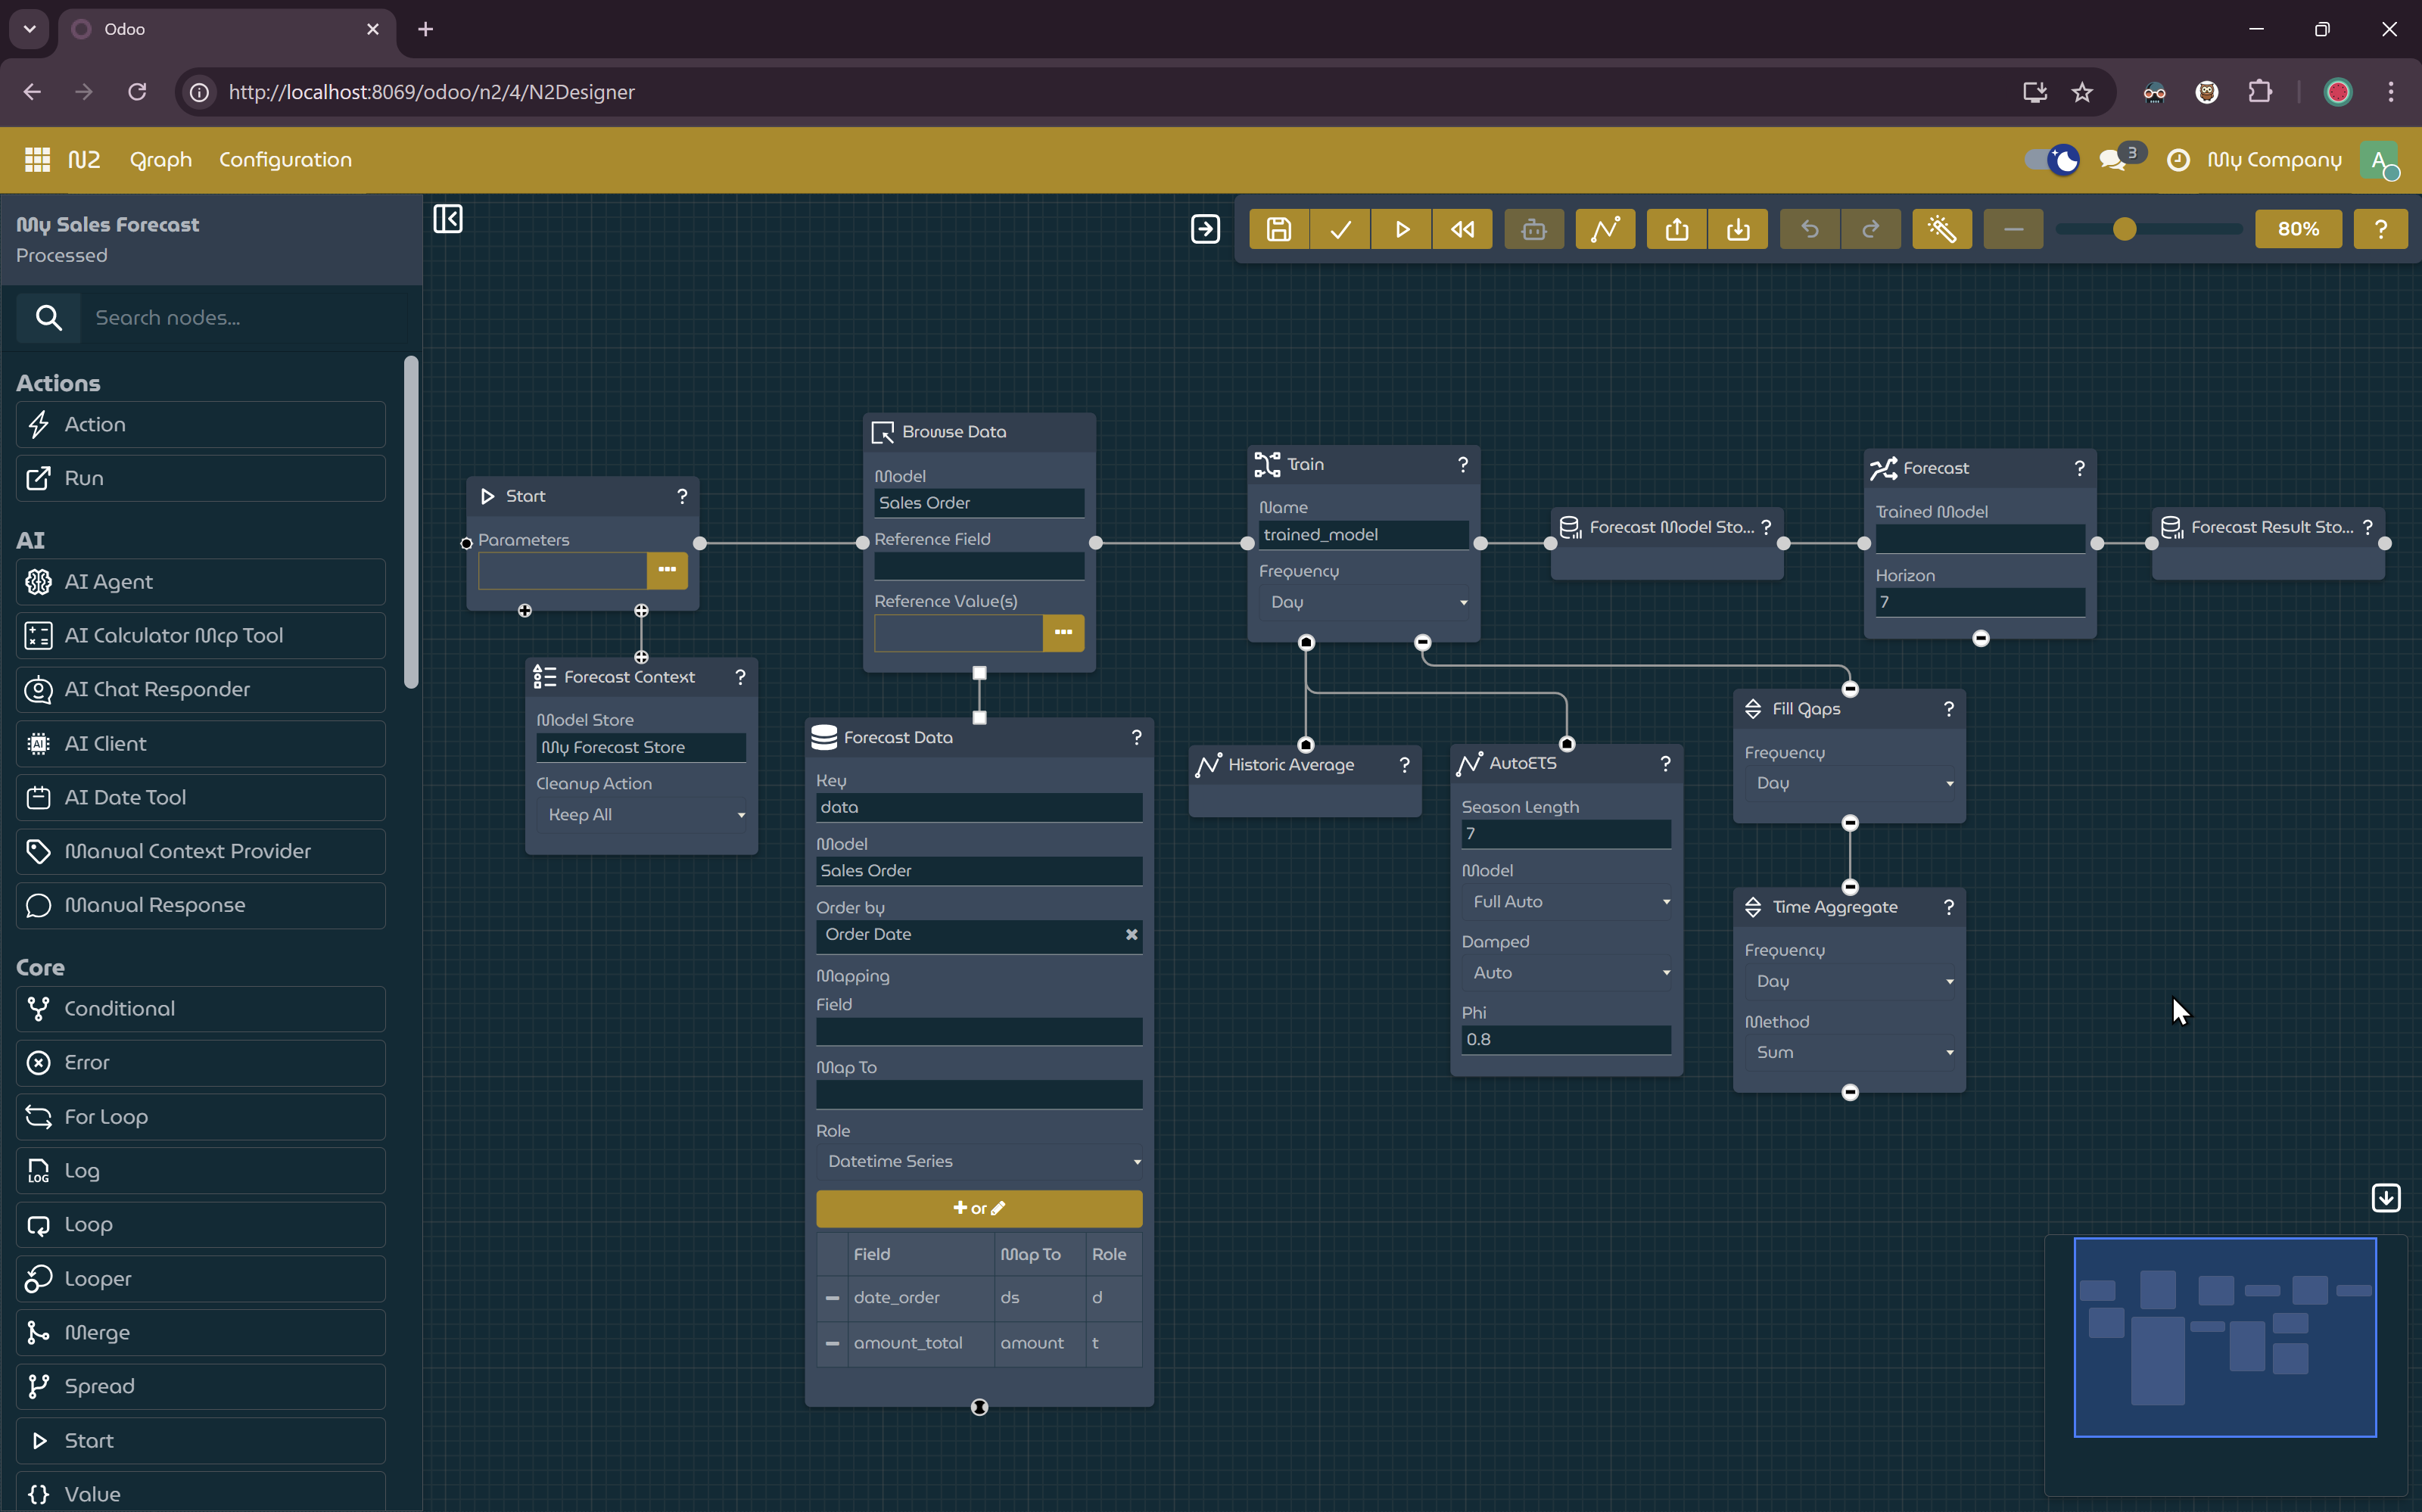
Workflow to create forecasts with Historic Average and Auto ETS.
- Click the
Forecast Visualizerbutton to show the forecast visualizer. - Run the graph.
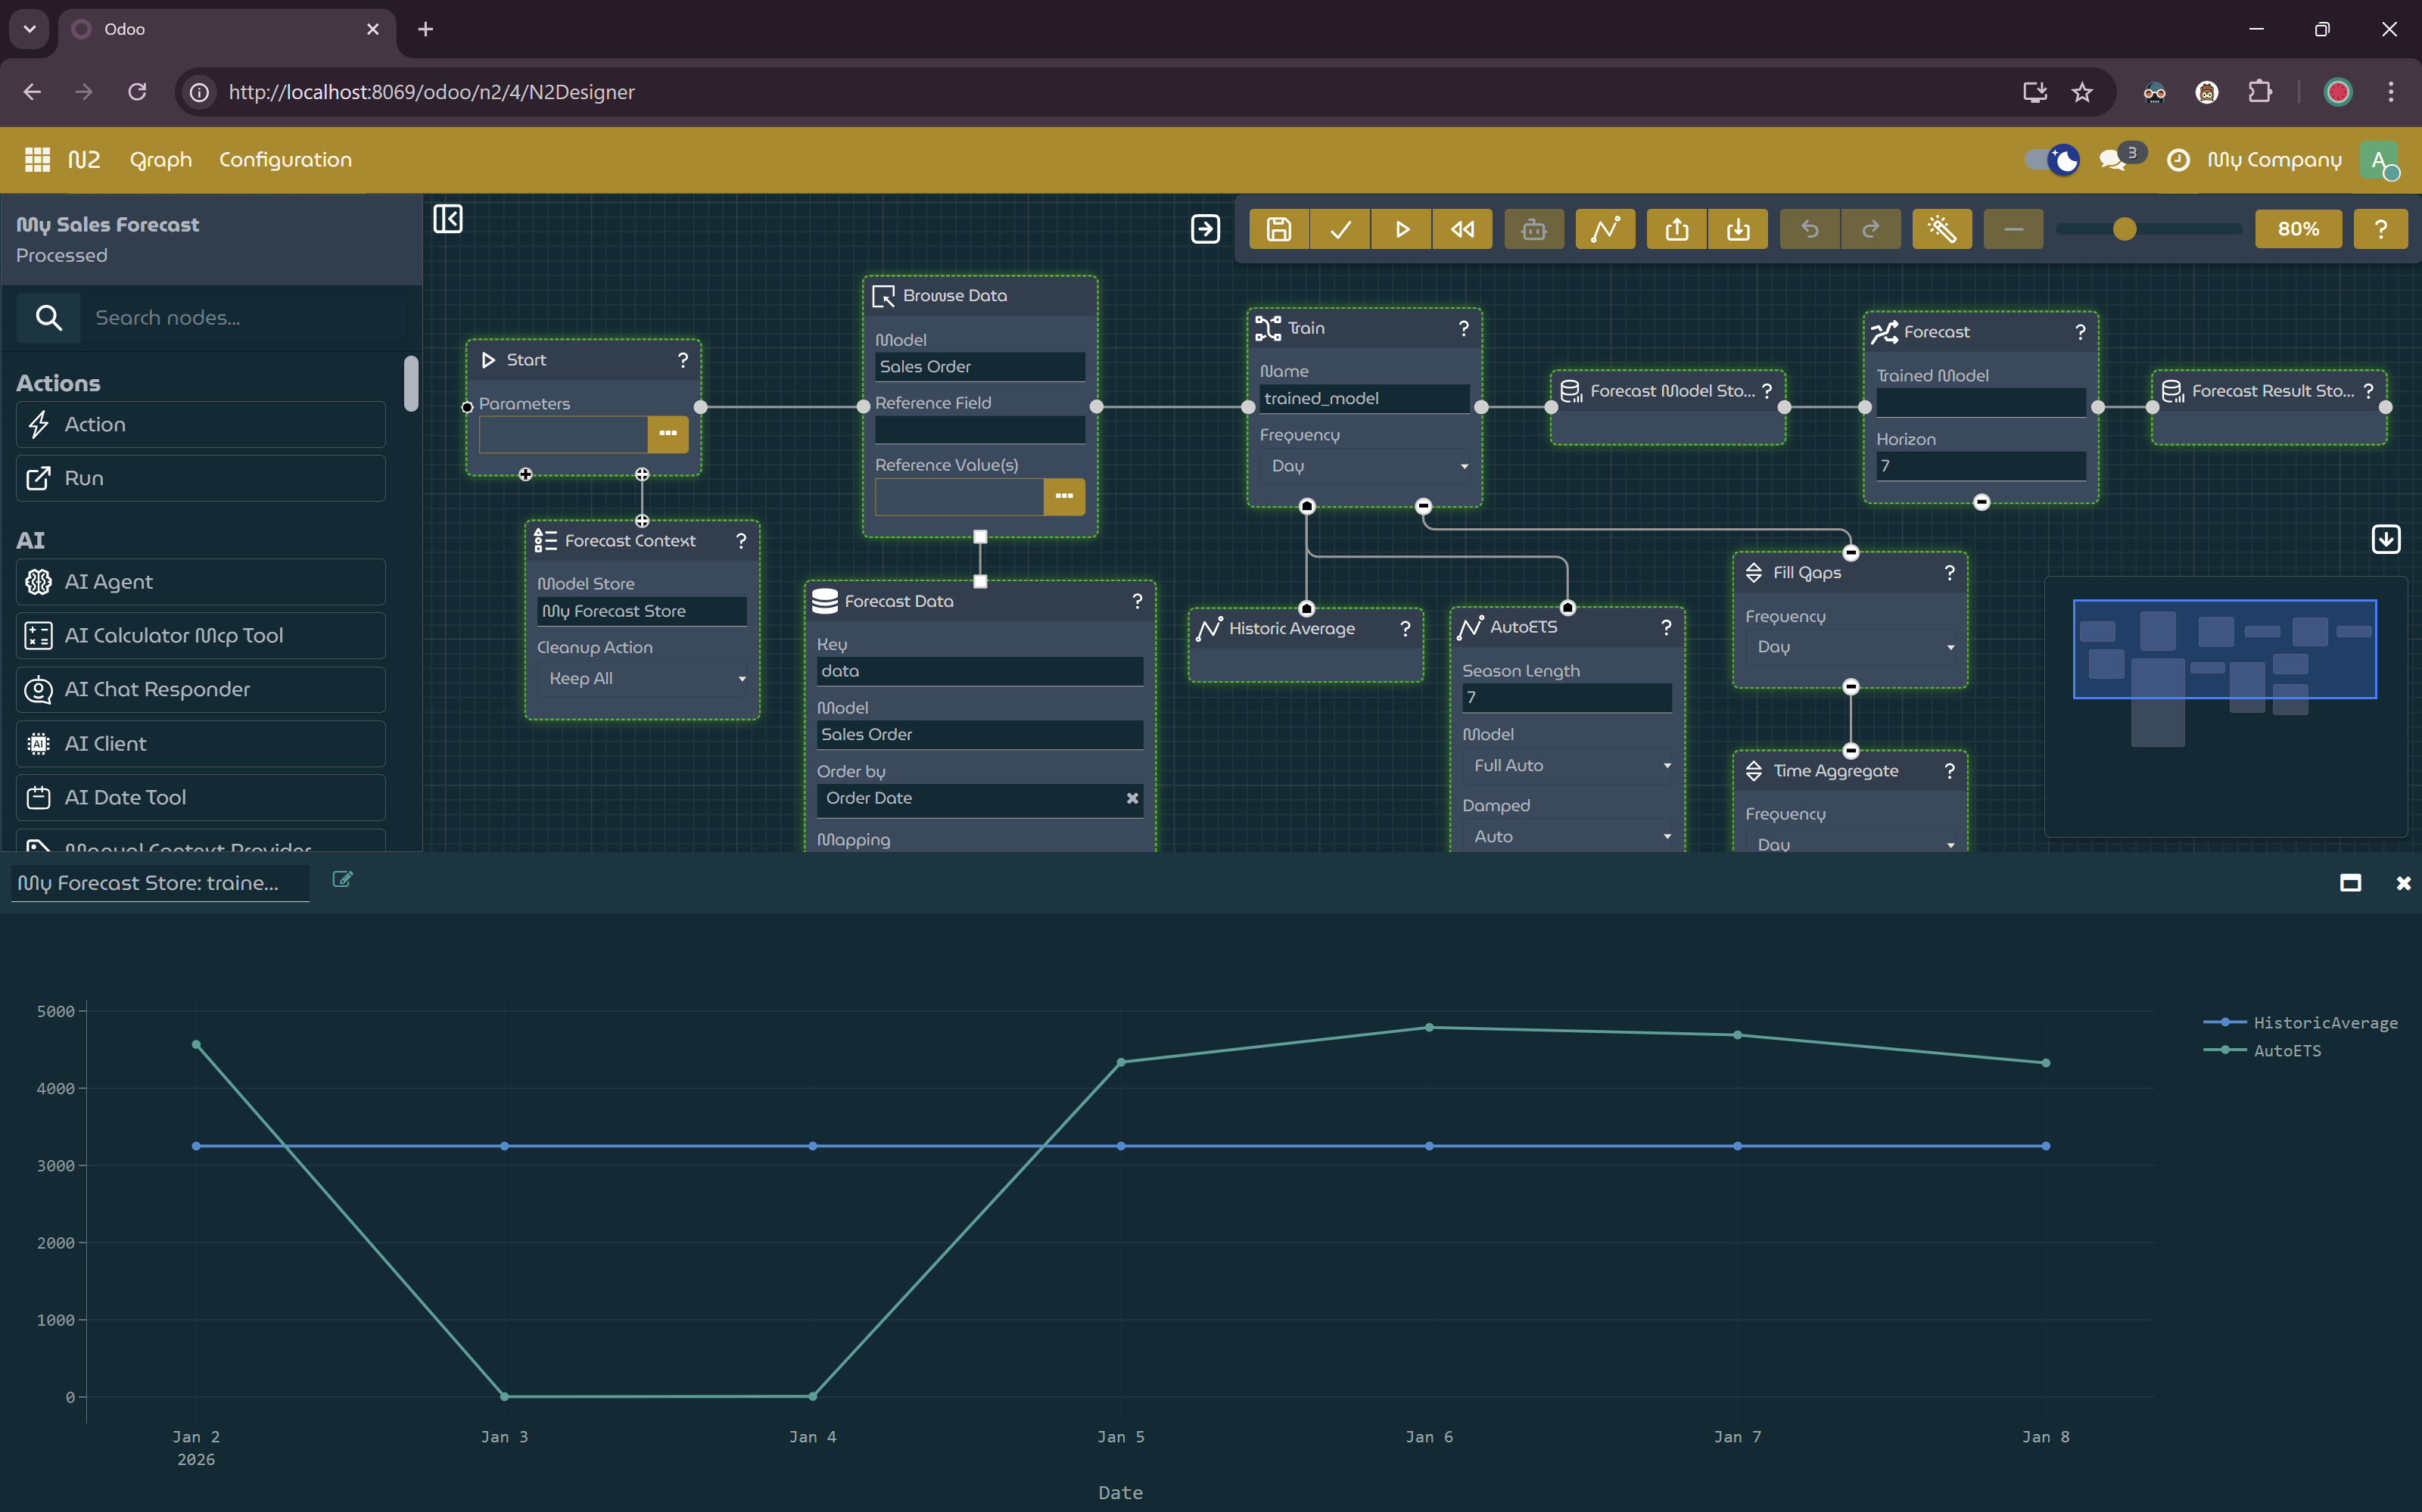
Workflow with forecast visualizer shown.
Explanation
This tutorial demonstrates how to build a workflow that generates statistical forecasts from historical data and visualizes the results using the Forecast Visualizer.
The workflow prepares time series data, trains forecasting models, and produces future predictions based on past sales behavior.
Statistical Forecasting with StatsForecast
The N2 Forecast module exposes the StatsForecast library as N2 nodes. This allows you to:
- Train statistical forecasting models directly within N2 workflows
- Use multiple forecasting strategies, such as Historic Average and Auto ETS
- Store and reuse trained models via Forecast Stores
- Visualize forecast results interactively
By combining these nodes, you can quickly experiment with different forecasting models and horizons using the same underlying data.
Next Steps
- Try adjusting the Horizon value to forecast further into the future.
- Experiment with different season lengths or additional forecasting nodes.
- Replace demo data with your own historical business data to generate real forecasts.